This primary season has been rather interesting to say the least. There is a former TV reality star running a show, spewing words that would be normally an automatic disqualifier if mentioned by previous candidates in previous election cycles. There exists a particularly angry voter base that scapegoats their fears and economic insecurities – often with understandable sentiments – at a ruling class they perceive as the establishment. You have people fixated on the character and honesty (or appearance of honesty) of candidates rather than their policies. And, as with the ’08 election cycle, you have a sense of hope in some candidates, as well as a sense of unsettledness about the possible nominees from the two major parties. The character of this unsettledness could perhaps be best described by these recent polls:
1 in 4 affiliated republican say they could not vote for the GOP nominee if said nominee was Trump[1]. 33% of Sanders supporters, according to a McClatchy-Marist poll would not vote for Hillary if she was the nominee[2], and 25% of voters would abstain from voting for one of the major party candidates if the nominees were Trump or Clinton[3]. It sure is an election of unique perspective, and uneasiness.
For me personally, this election was the first time I realized how much math is actually involved during an election year. However, for me, it’s not the polling which is of actual interest but rather some of the commentaries made by political pundits following each contest:
- Bernie does better in primarily white, non-diverse states
- Hillary does better among older and richer voters
- Bernie does better among independents, and in open/same day registration contests
- Bernie does better in caucuses.
What if based on the last 38 contest that happened in U.S. states (excluding territories, democrats abroad, etc) we could provide a model to predict not just whether Bernie or Hillary wins one of the next 14 contest, but perhaps also the margin by what each candidate will win by. (This will be focused on the Democratic primary).
This is exactly what I propose in this post.
The first weight factor I will propose is one that is based entirely on the logistics of the contest:
- Is it a primary or caucus?
- Is there same day registration?
- Is it an open or closed contest?
- What region is the contest held in?
For each of these factors I assign certain value of “pro-Bernie” points, or logistical information which I believe would provide Bernie a contest where he would perform better:
| Factor | Comment and Value |
| Primary or Caucus? | Because Bernie does much better in caucuses, I will arbitrarily assign a caucus an additive value of 4. |
| Same day registration or registration with a deadline? | Same day registration drastically helped Bernie. I assigned this an arbitrary, additive value of 3. |
| Open or closed contest? | It was noticed that this had no effect on how well Bernie did in previous contests. |
| Region (South, West, N.E., Midwest) | South – (-1)
NE – (2) Midwest – (3) West – (5) |
Here are the 39 contest summarized by election factor, to understand why I picked these values:
| Region | Count | Average of Bernie vote |
| South | 13 | 31.38462 |
| West | 3 | 74.7 |
| Midwest | 14 | 57.65 |
| N.E | 9 | 52.66667 |
| Primary Type | Count | Average of Bernie vote |
| Caucus | 13 | 64.87692 |
| Primary | 26 | 41.14615 |
| Open | 23 | 48.26522 |
| Closed | 16 | 50.19375 |
| Same day | 14 | 61.42857 |
| Deadline | 25 | 42.128 |
There is a clear correlation between the region the contest is held in, as well as whether it’s a caucus or primary, and whether there is same day registration or not. However, whether or not the primary was open or closed did not appear to have a significant effect (perhaps it’s more of a bundled factor with whether or not the registration was on the same day and the primary was open vs. the opposite).
Here is how I divided each state by region in the US:

Each of these components would then be added into an “Election” Factor (EF), which when plotted against actual percentage of votes Bernie gathered in the state would yield to the following curve:
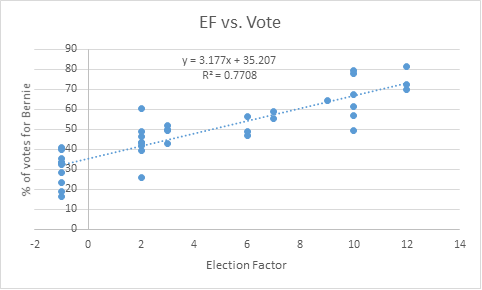
This gave a positive correlation with rather decent R2 value.
Now let’s get into the demographics of the state
The first “trend” that I often hear by political pundits is that Bernie does better in rural states. So I tested this hypothesis directly by comparing a graph of population density by state vs. the percentage of votes Bernie received in that state:
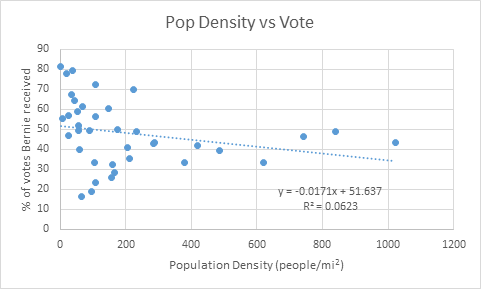
This was a rather weak trend, with a rather low R2 value that I decided to dismiss this factor into my final calculations. I guess the pundits aren’t always right?
Next demographic of interest is race, which surprisingly shows a rather strong correlation with the percentage of votes Bernie received. Often during the primary race I heard that “Bernie won that states because it’s a mostly white rural state.” Well we already threw out the rural hypothesis, but maybe the white one has some truth to it. So I decided to plot the percentage of white population of a state vs. the percentage of vote Bernie received:
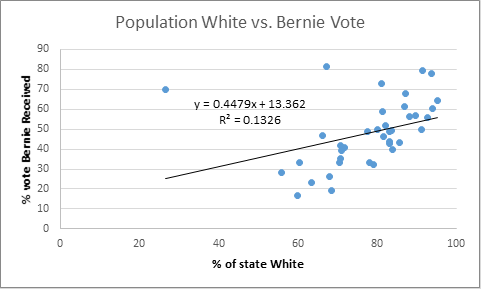
This demonstrated a slightly weak, but none the less non-ignorable trend between the lack of racial diversity in a state and the amount of votes Bernie received.
Now let’s do the same with the black population per state:

Now that’s a rather strong correlation…
Let’s do the same with the Asian population:
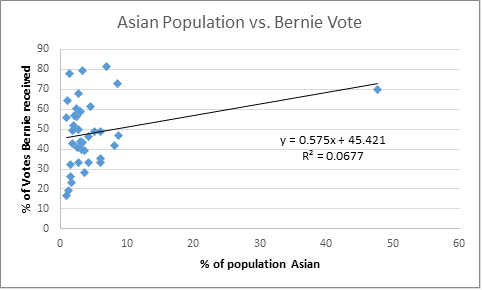
Again, not a huge correlation, although it’s worth notice that Bernie is not uniquely strong in diversity-lacking state, he did very well in Hawaii, a state that’s only 26% white.
What about the Hispanic vote?

With such a low correlation, it is safe to say that the Hispanic population in a state does not show a noticeable effect on the percentage of vote Bernie wins in that state. I’m going to rule this out of my model.
Now I will put all of the racial demographic variables together into a “Race” Factor:

Where mi, bi, R2 is the slope, intercept and R2 of the specific population segment i (white, black, asian). Pi is the actual population percentage of the segment i of interest. ai is an arbitrary coefficient of influence I designated based on how much influence each population segment had on the overall trend (1 for white, ½ for asian and 2 for black).
I then scaled the values so that they would be the same order of magnitude as the election factor (1-10). The highest value of the E.F. was 12, so I wanted the highest value of the RF to also be 12.
This yields an RF value vs. Bernie vote curve of:
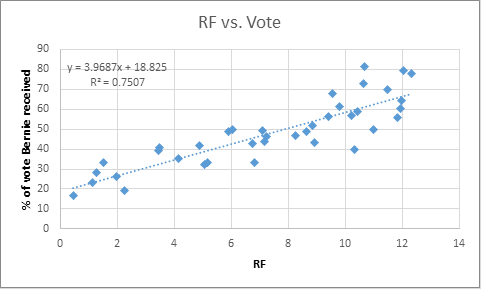
This gives a rather positive and strong correlation with R2 of 0.75.
Now let’s combine both factors into a final score per state (FS):

In this Si is one of the two factors of interest (EF, RF). I decided to remove the data point for Vermont as it was an outlier in my data (confirmed by a simple Q-test). The most likely explanation for Vermont is that as Bernie’s home state it gave him a much higher advantage unaccounted for in the E.F.
This gave me a final FS vs. percentage of vote for Bernie curve of:

This shows a very strong correlation between our engineered FS factor and the vote that Bernie received.
Now, we can test the remainder of the states:
| States | Total Delegates | Registration | Type | Region | EF | % White | Black | Asian | RF2 | FS | Bernie |
| California | 475 | Deadline | Primary | West | 5 | 79.07 | 7.45 | 13.47 | 9.0 | 42.8 | 53.2 |
| DC | 20 | Same day | Primary | N.E | 5 | 37 | 47 | 4 | 0.0 | 14.9 | 34.9 |
| Indiana | 83 | Deadline | Primary | Midwest | 3 | 84.3 | 9.1 | 1.6 | 8.2 | 34.5 | 47.7 |
| Kentucky | 55 | Deadline | Primary | Midwest | 3 | 84 | 8 | 3 | 8.7 | 36.0 | 48.7 |
| Montana | 21 | Same day | Primary | Midwest | 6 | 90 | 1 | 0 | 12.2 | 55.9 | 61.8 |
| N Dakota | 18 | Same day | Caucus | Midwest | 10 | 88 | 2 | 2 | 11.7 | 66.1 | 68.6 |
| NJ | 126 | Deadline | Primary | N.E | 2 | 58 | 13 | 9 | 6.6 | 26.4 | 42.4 |
| NM | 34 | Deadline | Primary | South | -1 | 40 | 2 | 0 | 11.7 | 33.3 | 47.0 |
| Oregon | 61 | Deadline | Primary | West | 5 | 76 | 2 | 6 | 11.7 | 51.2 | 58.7 |
| SD | 20 | Deadline | Primary | Midwest | 3 | 85 | 2 | 0 | 11.7 | 45.2 | 54.8 |
| West Virginia | 29 | Deadline | Primary | South | -1 | 92 | 3 | 0 | 11.1 | 31.7 | 45.9 |
The ones highlighted in green are the ones I predict he will have a definite victory. The yellow could go either way and the red I predict he will perform poorly in. This is entirely based on election logistics and demographics of the state.
I guess we will find out May 3rd when Indiana is up. Right now, according to polls, Bernie is behind by 6.6% points[4]. My model predicts he will lose by 4.6%. This agrees pretty well with the polls. Check back this chart May 3rd to see how my model holds up!
Resources:
[1]http://www.rasmussenreports.com/public_content/politics/elections/election_2016/no_trump_no_show_for_33_of_gop_voters
[2] http://www.wsj.com/video/poll-33-of-sanders-supporters-wouldnt-vote-for-clinton/69C05055-85FE-4320-8D02-3EAC972CACD0.html
[3]http://www.rasmussenreports.com/public_content/politics/elections/election_2016/24_opt_out_of_a_clinton_trump_race
[4] http://www.realclearpolitics.com/epolls/2016/president/in/indiana_democratic_presidential_primary-5807.html