Background
After a semester at UC Berkeley learning various machine learning and data science tools, I’ve decided to re-examine the model I built half a year ago to predict the remainder of the primary elections at the time.
I will be using the same key data:
- Geographic Region
- Election type (primary vs. Caucus, open vs. Closed)
- Demographics
In the previous model, I was using overall state-based demographic data since I did not have the computational skills at the time to handle more than 50 rows of data. However, with the Python skills I acquired over the semester, I decided to improve my model by adding more demographic and election data by using county level information provided by the US Census Bureau.
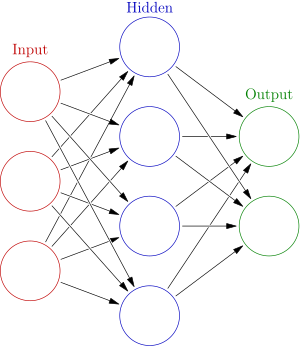
Instead of manually deciding which variables I think would exert the most influence on my model, I decided to let the model figure it out. I tried using both TensorFlow’s Convolutional Neural Network (CNN) using the Keras wrapper, as well as SKLearn’s Decision Tree Regressor.
Explanations of Algorithms
There is a key difference between the two algorithms:
| Decision Trees | Convolutional Neural Networks |
 |
 |
| How it works:
Decision trees can be thought as a collection of ‘if-then’ statements. They take an input data set and try to match the output data-set through a tree-like structure of if-then statements. Each node on the tree is known as a ‘leaf’ and each leaf assigns a value in a regression tree. The algorithm finds the best place to create a split in order to minimize the loss function (error) in the actual output vs. the output the decision tree creates. This is very similar to the game of 20 questions – you have to find the best questions in order to optimize the tree for new, unseen data. |
Neural networks are fundamentally different from decision trees. Rather than being ‘linear’ in their progression, from starting input to ending output, the data goes back and forth between ‘neurons,’ before returning to the output layers. However, having very large inputs will create very large number of hidden neurons between the input and output layer. To reduce the number of neurons, we create a convolutional neural network. In a CNN, an input layer is reduced to one neuron as it progresses through each layer. Additionally certain variables might add weight on others in the network. |
| Problems:
One major problems with decision trees is over-fitting your training data. While over-fitting might results in 100% accuracy with your training data this could leave to catastrophic results with unseen data. One way to limit overfitting is by limiting the depth of the nodes, or pruning (removing random leaves) after overfitting
|
Problems:
CNNs are an active area of research and are still poorly understood. They are often over specified for very specific data and might not work well on new data. This is because its hard to predict or figure out which type of layer, or activation function might work best for certain applications. Often people will build two completely different architecture of CNN that will work well with some data sets but not up to par with others. |

I decided to do a CNN instead of Recurrent Neural Network (RNN) because I believed my input data to not have much inter-correlation between each features. However, I will be testing an RNN in the future because I am still curious about the possible results.
Model Summary
I began by creating a data set that combines the county vote results with the demographic and election data. I then separate the data into states that had already had their elections by March 22nd, and states that had yet to hold an election. I only took into consideration the democratic primary results. I further split the data into an 80% train-test ratio to not overfit both models.
For the CNN model, I built the model using 4 dense layers, with a sigmoid, softmax, and hyperbolic tangent activation layers. These layers are friendly to continuous, regression data. This created a model with almost 70 thousand parameters.
For the decision tree, regression model, I set the max depth to be 30 leafs, so as to not over-fit, and set the maximum features to be the square-root of the input features. I also used sklearn’s AdaBoostRegressor. This helps with continuous data as it provides a smoother output instead of a step-function output, by superimposing multiple decision tree (in my model, 1000 decision trees).
Results
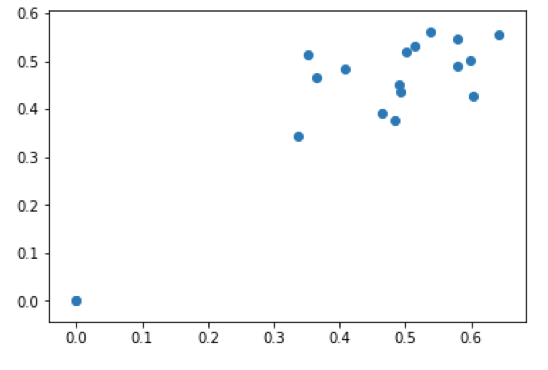
To visualize the results, I created an output graph for each model of the predicted vs actual election results. The more accurate, the more the slope would approach unity:
| Decision Tree Regressor | Convolutional Neural Network |
 |
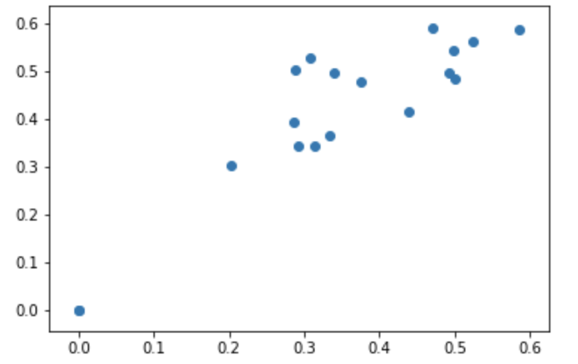 |
| Mean Error | Mean Error |
| +1.19% | -6.54% |
Here is the state by state prediction error for both models:
| State | DTR Predict Err (%) | CNN Predict Err (%) | Actual (%)* |
| California | +17.6 | +2.44 | 41.5 |
| Delaware | +7.45 | -10.63 | 39.3 |
| Indiana | -1.86 | -4.50 | 54.3 |
| Kentucky | -10.16 | -15.54 | 49.5 |
| Maryland | -0.66 | -9.93 | 30.2 |
| Montana | +0.95 | +1.85 | 48.3 |
| New Jersey | +10.80 | -3.02 | 36.5 |
| Oregon | +8.51 | -0.15 | 58.7 |
| Pennsylvania | +4.11 | -5.11 | 34.3 |
| Rhode Island | -1.87 | -21.67 | 50.4 |
| South Dakota | +8.92 | -0.57 | 49.8 |
| West Virginia | -16.27 | -21.90 | 52.8 |
| Wisconsin | -2.33 | -12.05 | 59.2 |
| Wyoming | -3.44 | -3.97 | 56.3 |
While the error for the DTR model was more centered about zero, it provided more catastrophic results (above 5% error) than the CNN model. If the CNN model was linearly calibrated by 6% at the very end, it would have had two less catastrophic results, and would have been significantly better. Overall, both of these models resulted in more problems than the state-wide analysis. I attribute more data to more error as perhaps a case of Simpson’s Paradox.
However, perhaps by combining a linear combination of these two models, an even better model could be made than the previous model with just state-wide data. There are many more variables that I could further explore in the DTR and CNN library as well, that could perhaps optimize this model further.
*This calculation was achieved by weighing each county’s population with their votes, which may not be the same results from the published voting results by the state but is more accurate for the data used in these models.
Interesting connection – GOP vs. DNC
Just for curiosity, I decided to run the same CNN and DTR model on the GOP:
| Decision Tree Regressor | Convolutional Neural Network |
 |
 |
| Mean Error | Mean Error |
| -18.02% | -17.4% |
Both of these models outputted predictions with significantly greater error. I interpret this to mean that democratic voters fit more ‘neatly’ into specific demographic groups outlined by the census data than GOP voters.
Interesting connection – weights
I decided to further analyze in the DTR Model which variables were most prominent in calculating the percentage of votes received to each candidate in the DNC primary.
I outputted the weights from the trained DTR Model:
| Variable | Description | Weight |
| Type | What type of election was held (primary or caucus) |
0.025561 |
| RHI125214 | White percent | 0.027758 |
| AGE135214 | Person under 5 yrs, percent | 0.028681 |
| Open | Whether the election was opened or closed |
0.028841 |
| LND110210 | Land area | 0.029259 |
| RHI525214 | Native Hawaiian/Other Pacific Islander percentage |
0.036283 |
| RTN131207 | Retail sales per capita | 0.040708 |
| HSG495213 | Median value of housing units |
0.050376 |
| RHI225214 | Black or African American percentage of population |
0.069465 |
| Region | In which geographic region of the US the election was held |
0.249174 |
The region of the voter has a significantly greater impact (by one order of magnitude) on the results. As expected, the geographic south and west voted very differently in the democratic primary. Perhaps less expected, was the importance of the election type (open, closed, caucus, primary) as well as the racial make-up and certain odd economic factors (retail sales, median value of housing) of each county.
If you would like to see my Jupyter notebook or data set, please contact me!